Kolkata: India Data Portal (IDP), from the Bharti Institute of Public Policy (BIPP) at the Indian School of Business (ISB) recently released the ‘Nightlights’ data for Punjab, from 2015-2020 available at Assembly Constituency level. The report gives a year-by-year comparison of the change in luminosity that demonstrates how economic activities have expanded to newer areas, whether areas have transformed from no light to light and light to more light regions, says a press release from India Data Portal.
Speaking on the data release, Prof. Ashwini Chhatre, Executive Director – BIPP, Indian School of Business, said, “Night-time radiance and lit pixel as captured by satellites measure the change in economic activity. It is a reasonable indicator for GDP at the national and sub-national levels. It also helps to understand the impact of COVID-19 on economic activity. The data allows the discussion to focus on questions around patterns of economic growth and quality of governance. Through this report, you can see and compare economic activity over a six-year period for 2015-2020 in each assembly constituency.”
The report has three major indicators from nightlight data that shows varied ways to capture the depth of the economic activities.
The Change in total radiance between 2015 to 2019 depicts a surge in economic and developmental activities in the area like SAS Nagar, which showed the most increase of 3000 pixels in these five years, followed by Kharar. But some constituencies have shown a decline and reflects a shift of developmental activities in other regions. In terms of change in percent lit pixels, 34% of the constituencies have shown no change highlighting the developed nature of the state. Further, 35% have established a percent rise in lit pixels between 2015 and 2019.
The report also studies the pandemic impact in the constituencies of Punjab between 2019 and 2020 from the nightlight data. The change in total radiance demonstrates 75% of the constituencies in Punjab remain immune to the pandemic effect. The change in percent lit pixels indicates almost 58% of the constituencies in Punjab had a very subdued impact of the pandemic, and the economic activities largely remained unaffected between 2019 and 2020. Twelve constituencies have endured the pandemic effect and have indicated the highest growth in economic activities shown in the report.
The three nightlight variables highlighted here include total radiance, change in the total number of lit pixels and percentage change in lit pixels. An increasing number of lit pixels suggests that economic activity is expanding to new areas, as previously dark pixels show radiance in satellite images. On the other hand, total radiance denotes increasing economic activity without saying anything about its distribution over space.
The data is available with Bharti Institute for Public Policy for research that will further help to assess and track the development and progress for various indicators.
India Data Portal has also prepared a detailed Insight into the Punjab economy traced from 2011 to 2020. It looks at the per-capita income of Punjab, Annual growth of India’s GDP, Agri economy, unemployment, and Poverty Ratio (BPL) in Punjab and All India and many other indicators. These two reports can, through exciting insight into the state of the Punjab economy in a glance.
India Data Portal earlier had released detailed reports on Nightlights as indicators of economic growth for Goa and Uttarakhand.
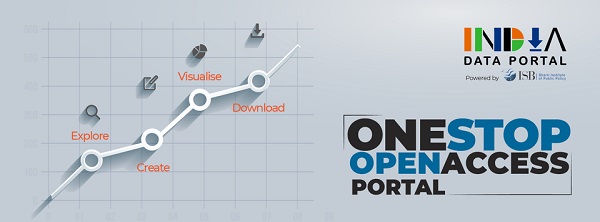
About India Data Portal: The ideation behind building “India Data Portal” came from creating a one-stop open-access portal for journalists and simultaneously aiding the researchers, students, policymakers with the access, interaction, visualisation of the complex data related to agriculture and financial inclusion Food and Agriculture, Economy, Union Budget, Socio-Economic, Rural Development and General domain. The IndiaPulse@ISB is an initiative to track the economic recovery process in post-Covid-19 situation through high-frequency. The portal currently hosts 49 datasets, including agriculture, financial inclusion, rural development, socio-economic data, NSSO rounds etc., including the recent Budget Data. More data on other sectors, such as education, health, crime and assembly elections, will be made available soon on the portal.
Salient features of India Data Portal: Easy access to complex data, dynamic Search Bar, Instant data-visualisations with a single click of a button, flexibility to select indicators for individual content requirement, datasets and indicators on the portal communicate with each other, can be selected to create new insights and choices of the colour pallet. 2. Create your own indicator: By using mathematical operations, users can create their own indicators that can be visualized. 3. Comparing Variables across Datasets: India Data Portal provides the unique functionality of comparing variables across different datasets. More details at: https://indiadataportal.com.
About Bharti Institute of Public Policy (BIPP) at Indian School of Business: Indian School of Business is a world-class business school committed to creating young leaders through its innovative programmes, outstanding faculty and thought leadership. Bharti Institute of Public Policy (BIPP), Indian School of Business (ISB), focuses on research and education in the domain of public policy. The institute works on policy challenges across diverse domains, primarily Agriculture and Food, Environment, Education, Finance, Governance and Digital Identity. The flagship programme of the institute is the Advanced Management Programme in Public Policy (AMPPP), which caters to mid and senior-level professionals both from the public and private sectors.
The Press Release has been provided by India Data Portal. The Reporting Today is not responsible in any way for the content of this article.